
|
|
||
The Swing DebugGraphics utility is a design tool that you can use to test whether your Swing components are being drawn correctly. With DebugGraphics, you can highlight component parts in bright red as they are being drawn. Then you can monitor them as they are being created and observe exactly how all drawing operations are taking place.
You can also use the DebugGraphics tool to write a message to stdout every time your application makes a graphics call.
By monitoring the red flashes that are displayed when the DebugGraphics tool is operating, and by examining the stdout messages that DebugGraphics can generate as component-drawing operations take place, you can detect errors in the way your components are being constructed.
The best way to see how the DebugGraphics tool works is to try it out. After installing Swing by following the instructions provided in the README file, execute the SwingSet demonstration program in the Examples folder. Then tab to the DebugGraphics panel, which is shown in the following illustration:
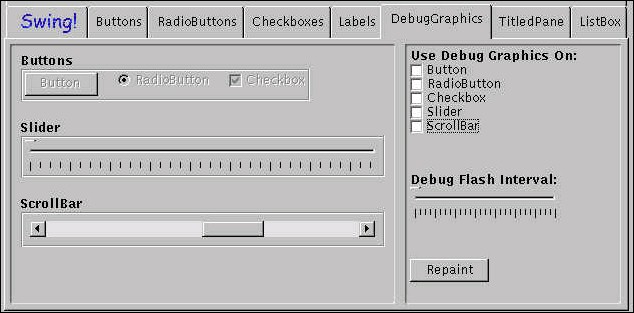
To try out DebugGraphics, just check one or more of the checkboxes labeled "Use Debug Graphics On." Then click the repaint button and watch as DebugGraphics draws the component or components you have chosen, using red highlighting.
To change the speed at which the DebugGraphics draws (and highlights) components, use the slider labeled "Debug Flash Interval."
NOTE: When you set DebugGraphics options for a particular JComponent object, all of that object's children inherit the behavior you have set. So you should try to limit your tests to something not too terribly deep.
To learn more about how the DebugGraphics tool works, examine the source file named DebugGraphicsPanel.java in the SwingSet example project. (That's the source file that produces the panel shown at the beginning of this specification.) By altering the source code in the DebugGraphicsPanel.java file, you can make the sample program's DebugGraphics panel behave in different ways. Try this:
Find the super(true) statement in the DebugGraphicsPanel.java file and change it to to super(false). That operation turns buffering off. In this way, you can turn buffering on and off, as well as turning debugging on or off, for particular components displayed in the panel. As you experiment, you may notice that turning off buffering has various side effects. Becoming aware of what they are, and learning how to manage or avoid them, can help you become a better developer of Swing components.
Swing implments DebugGraphics using two JComponent methods:
setDebugGraphicsOptions()
and
getDebugGraphicsOptions()
The setDebugGraphicsOptions() method takes an integer argument that can have one or more of the following values (you can use the bitwise OR operation to combine these constant values if you wish):
NOTE: Currently, if your component is displayed inside a JPanel that is buffered, the FLASH_OPTION is not visible. It actually does occur, in the in the offscreen image that is being drawn -- in fact, it consumes time. Unfortunately, however, you don't see it. This anomaly will be fixed when work is completed on certain double-buffered/backstore operations used in JFC and when the BUFFERED_OPTION setting is working properly. Meanwhile, you can use the LOG_OPTION setting, which does work inside buffered panels.
(Also, some drawImage() calls don't flash or perform logging operations logging in the current preliminary release of Swing, but this will be fixed later, too.)

Version 0.5. Last modified 09/04/97.
Copyright © 1995-97 Sun
Microsystems, Inc. All Rights Reserved.